Introduction
Location spoofing systems are designed to disrupt and mislead positioning systems. This technology is mainly used in security applications and sometimes research. The product we are introducing is capable of spoofing the location and also jamming the signal. In the case of GPS, such a system can cause the positioning process to be interrupted by the receiving device.
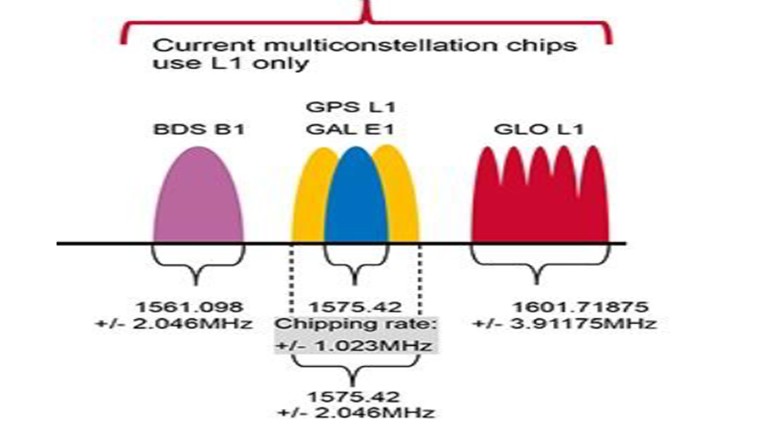
This product generates fake positioning signals for 4 GNSS systems, including GPS-L1, Galileo-E1, Beidou-B1 and Glonass-L1, to spoof the location. This system also outputs the golden code string of each system’s satellites (without navigation data) to disrupt the receiver’s acquisition block.
The jamming system, by broadcasting a high-power golden code string of satellites through an antenna in the operating frequency range of each system, disrupts the acquisition of real signals by the receivers. During this process, the receiver device loses its connection with the satellites. In commercial terms, this device is called an antenna blinder or jammer.

Brief introduction to hardware
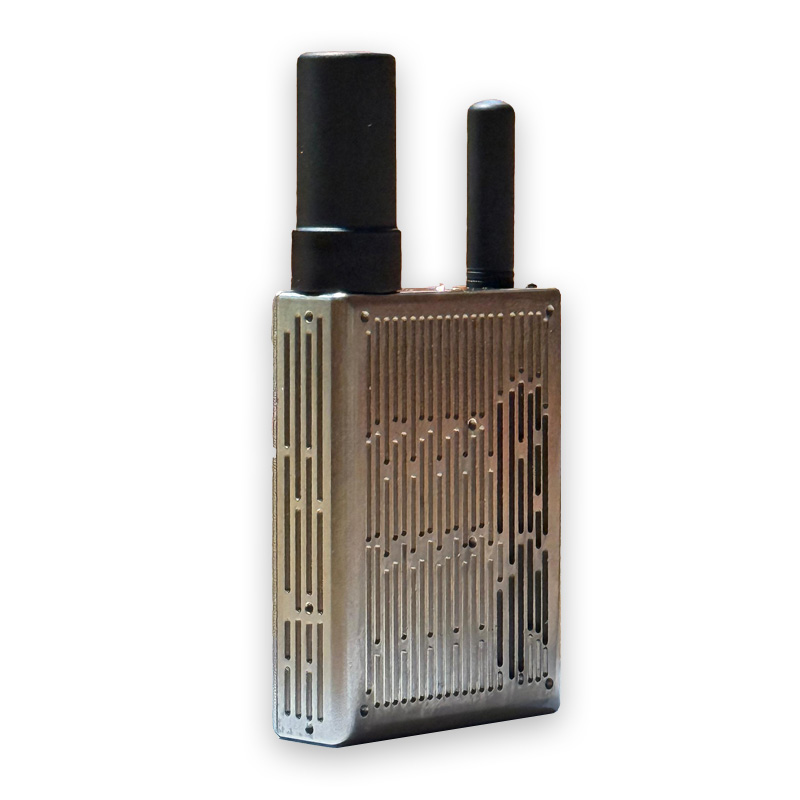
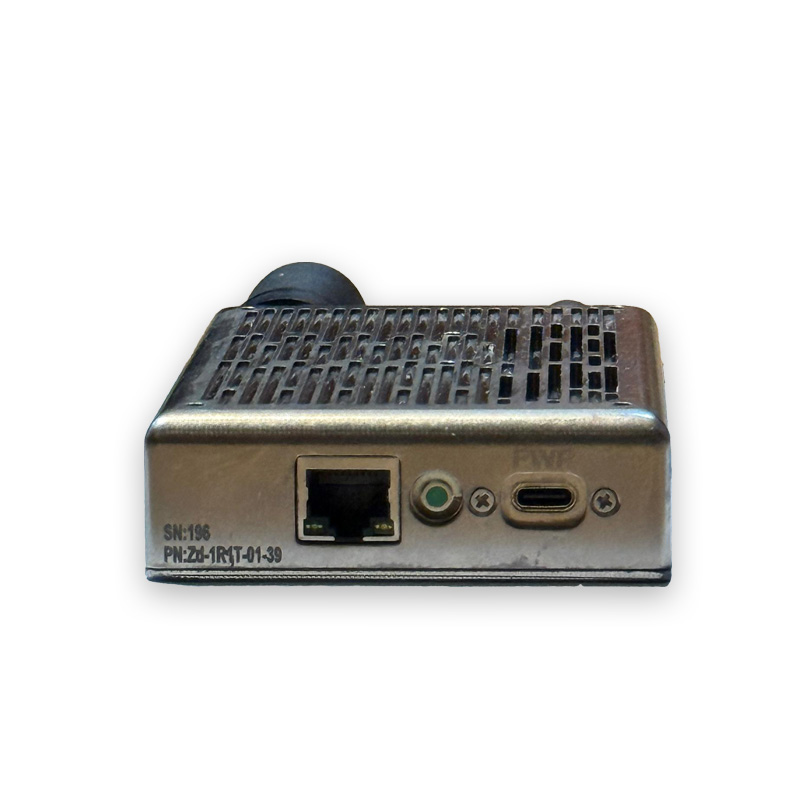
The hardware components of the mentioned product are shown in Figure 1. This product consists of two separate antennas for sending and receiving data and a processing set. The processing box contains a processing board, a UBLOX positioning receiver, and an SSPA (power amplifier) board with an output power of 1 to 2 watts. The processing board also has a ZYNQ FPGA processor and an AD9361 SDR chip.
According to the diagram, the FPGA first updates its navigation data using the UBLOX receiver and then creates a digital jammer signal to match it. Then, the digital jammer signal is sent to the input of the AD9361 chip, and the DAC output of this chip is sent to the input of the SSPA board. Finally, we will have a signal with adjustable power and a maximum power of 1 to 2 watts at the output of the system, which will be radiated by the antenna in the desired range.
Product hardware components
The frequency of the output signals of the systems, in other words, the operating frequency band of the system is as shown in Figure 2. As is shown in the figure, the output signal frequency is in the range of 1559 MHz to 1606 MHz.
User Interface
The user interface for working with this product is a web-based software. The software is automatically running on the onboard processor. To control the system settings, it is enough to connect the system to a PC via a network connection. Using this software, the user can set the deception situation scenario, the system output power, the duration of deception data transmission until the next navigation data update, etc. In addition, he can view the number of satellites seen in the sky and the signal reception and transmission status as an output log. In Figure 3, you can see the output log display and the number of satellites for all 4 GNSS systems in the user interface.
For jamming, 5 scenarios are generally considered as follows:
Scenario 0 (MyLocation): In this scenario, the target receiver will see the current position of the system as fixed instead of its own position.
Scenario 1 (Airport): In this scenario, the target receiver will not see its original position during positioning, but will see itself moving at a fixed speed around the specified airport. This movement is in the form of a closed loop path.
Scenario 2 (Radius): In this scenario, the target will see its position as fixed at a random location between the min radius and max radius of the current position of the jamming system.
Scenario 3 (FixPoint): In this scenario, the target will locate itself at a fixed location.
Scenario 4 (Path): In this scenario, the target will see itself moving at a fixed speed in a loop path in a specified area.
Scenario 5 (Jamming): In this scenario, the signal Jamming is sent from the output of three channels in the channel band, which only causes interference to the target receiver, not deception. In the user interface, the location of different scenarios can be easily read, changed on the map, and saved. Figure 4 shows a view of the user interface for deception scenario settings.
You can also change the coordinates of a point or point in each scenario through the map. Figure 5 shows the layout of the user interface for determining the coordinates of a deception location on the map.
Finally, if we receive the jammer data with another receiver such as UBLOX, we will see that the receiver is locked on the satellites and the received satellites are colored green and the tracking rings are in the 3DFix state. Also, the user with a smartphone will be deceived into thinking that his position is in the target position. Figure 6 shows the data received by the UBLOX receiver in the u-center software. As you can see, the received satellites are colored green and the tracking rings are in the 3DFix state.

Displaying the output log and satellite numbers in the user interface

Scenario settings in the user interface
Determining the coordinates of deception scenarios with the user interface.